
The Liquidity Tracker is a free, web-based tool that provides a snapshot of Liquidity and Quote Size for over twenty futures contracts across major global exchanges.
QB’s Liquidity Tracker can be used for:
Analyze book depth, bid-ask spreads in real-time**
Visualize the current Regime (Request Whitepaper Here)
Market impact analysis
Risk management
Research tool
Liquidity

Liquidity is easy to identify but difficult to define. It is the ability to meet market demand and absorb market participants’ traded volume.
“Ability to buy or sell significant quantities of a security quickly, anonymously, and with minimal or no price impact.”
How Does QB Liquidity Tracker calculate liquidity?
QB uses the inverse of illiquidity as the measure of liquidity on this tracker. Illiquidity is the average volatility in volume time. An illiquid instrument will have higher volatility in the same volume time.
Volatility is measured using the mid-price changes in 15-minutes intervals and is a proprietary measure to QB.
Volume time is the number of traded contracts within the same timeframe as the volatility measurement.
Volatility is approximately measured as average magnitude of the mid-price changes in 15-minutes
Volume Time is the volume traded in the same interval of 15-minutes
Quote Size
Quote Size
Quote size is the quantity of securities tradable at the bid and offer. It represents supply and demand at a given point and time.
How do we calculate the quote size?
We report the trade-weighted average of the top of book quote size, measured in 15-minute intervals. We show todays’ quote size against the previous 10-day quote size in the same intervals.
Example: we compute the above quote size from 10:00 to 10:15 a.m for the last 10 days and report it as the historical average for the 10:00 to 10:15 bin.
A Transparent View of Liquidity
“Is now a good time to trade?”
QB’s clients have long inquired about the best time to execute in the market. Make informed decisions with the Liquidity Tracker and determine the quote size and liquidity before trading. Learn more about our execution algorithms.
Case Study: Silver Futures Average Liquidity
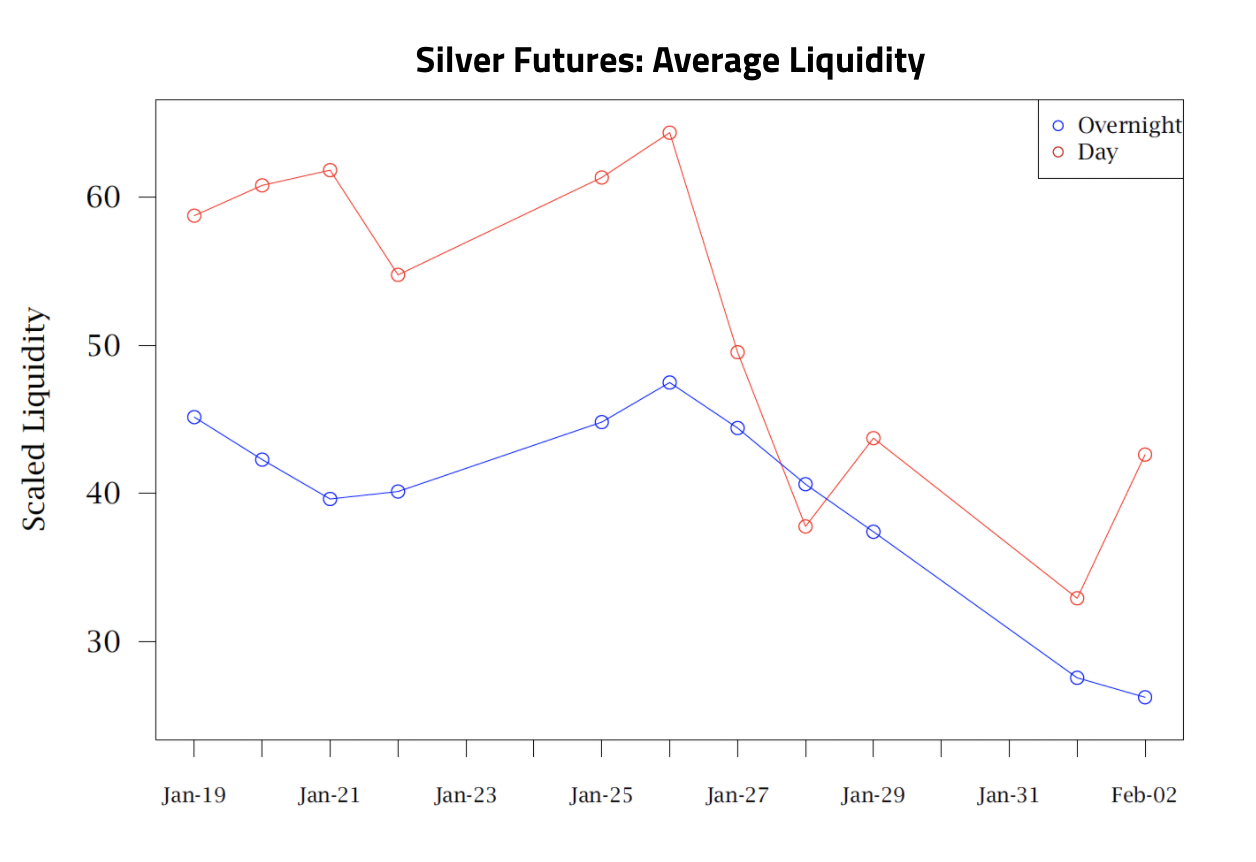
The image above shows the average liquidity of silver futures across the term structure broken down by overnight and day sessions. The overnight session is indicated in blue; the day session is in red.
On January 28th, around 3am (ET), a few days before the short squeeze frenzy, we detected abnormally low liquidity compared to historical averages.
Combining this information with QB’s proprietary analytics provided traders with the opportunity to: increase order duration, work order size, or, more broadly, choose an appropriate execution benchmark. Request the full paper here.
Disclaimer:
** Tracker automatically refreshes every 15-mins
** Exchange time default to exchange and contract
** Tracker updates at the end of the day 6pm ET as QB stacks recycle