Liquidity and Quote Size Changes in Futures
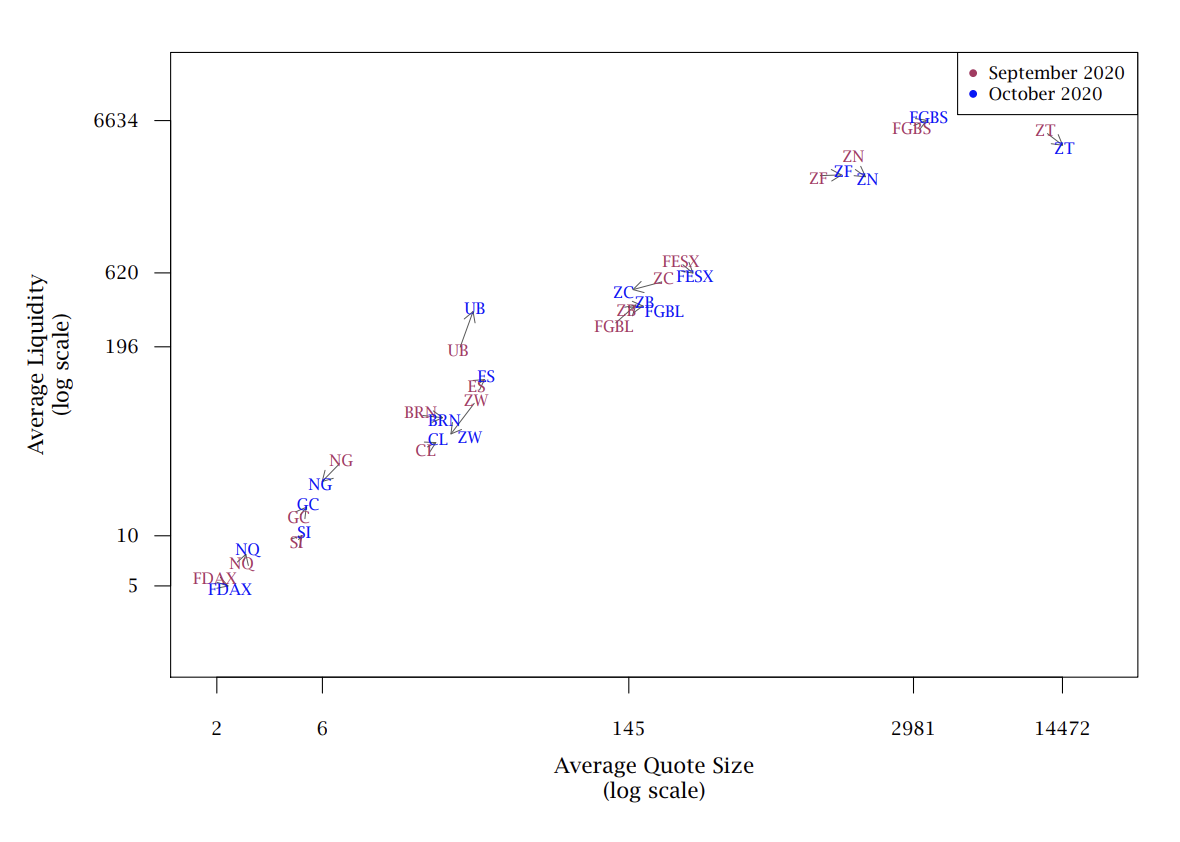
We look at the most traded symbol for several instruments across different exchanges to report the average daily quote size and liquidity of October 2020. We compare the same against the liquidity and quote size of last month as well as October 2019. Additionally, we look at the term structure of crude and brent oil. The data used for this analysis is from September 1𝑠𝑡, 2019 until October 21𝑠𝑡, 2020. The year over year analysis is particularly useful for the two energy futures as seasonality tends to play a key role. The analysis is timely as it sets the stage for the upcoming presidential election.
Fill out the form below to request a copy.

