At Quantitative Brokers, we understand the importance of transparency in trading in today's rapidly changing financial landscape. When paired with QB’s Algorithm Suite, our cutting-edge analytics suite offers unmatched transparency, helping you confidently optimize your trading strategies and achieve your financial goals.
But don't just take our word for it - experience the power of our toolkit for yourself. Try it now with our real-time simulator and discover how Quantitative Brokers can help you stay ahead of the curve. After all, intelligent execution, it’s all we do.


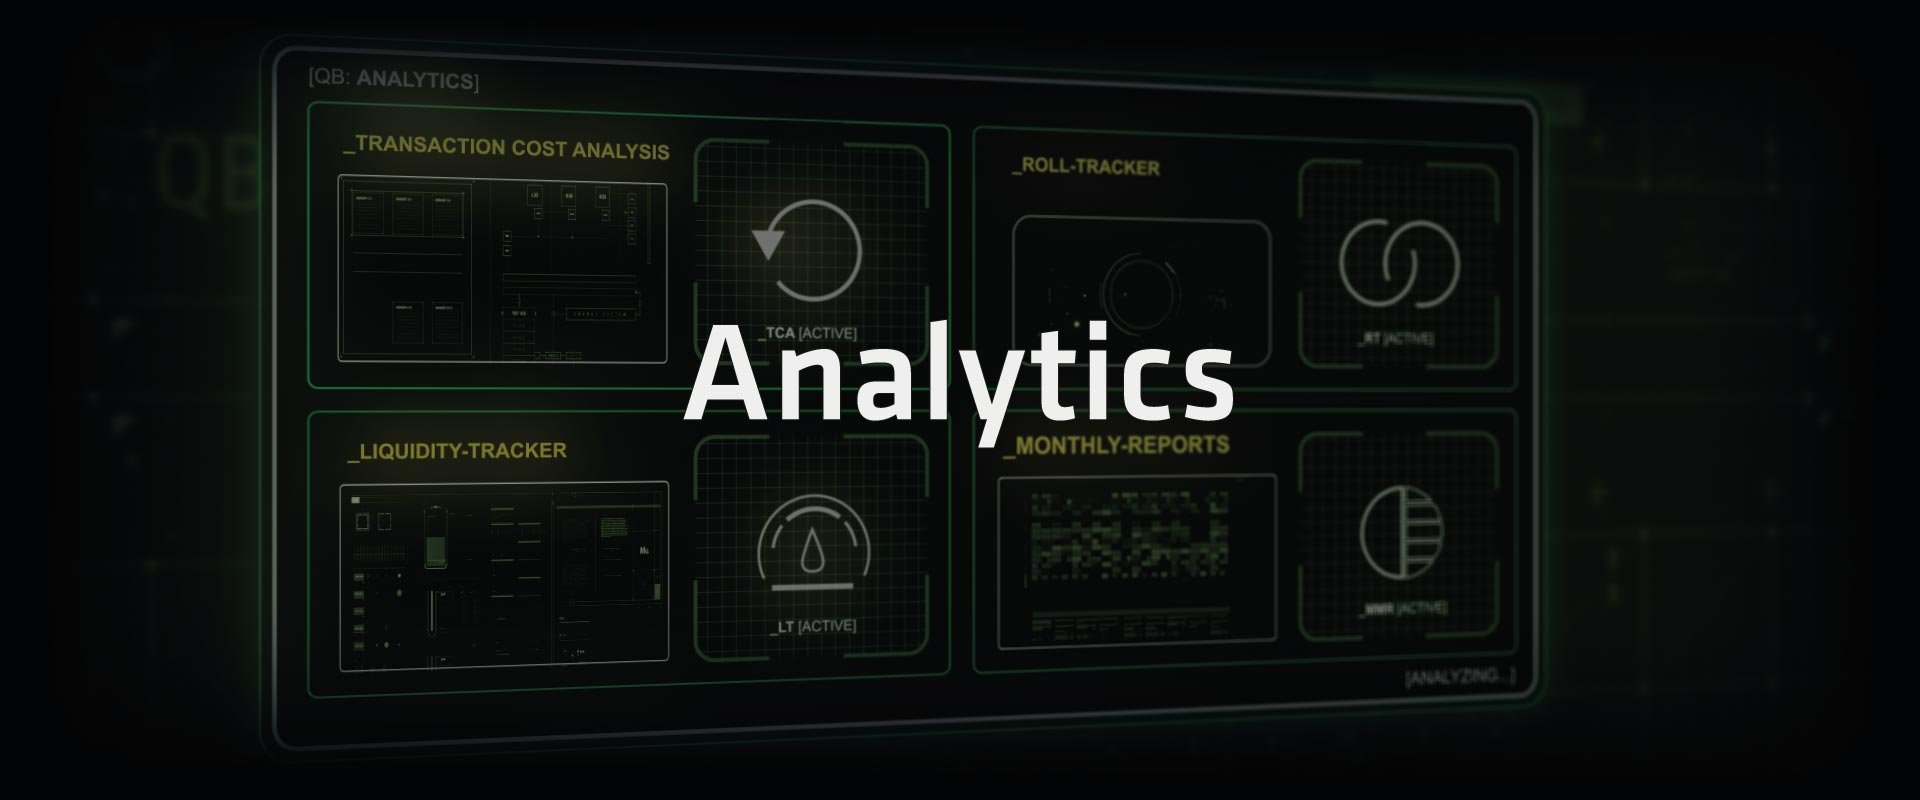
In Focus: Transaction Cost Analytics
Transaction cost analytics (TCA) is a powerful tool that measures and analyzes the costs of buying and selling financial instruments in markets. Initially developed in the 1980s exclusively for equity markets, the earlier versions of TCA focused on direct costs like commissions and spreads.
As trading activity increased and technology advanced - later versions of TCA also considered indirect costs such as market impact and opportunity costs. In 2012, Quantitative Brokers became the first provider of TCA for fixed-income markets to bring the powerful insights of TCA to the wider market.
Trends in electronic and algorithmic trading continue to gain popularity and so does the use of TCA. Today it is a crucial tool for institutional traders to evaluate trading strategies, optimize execution, and manage risk and Quantitative Brokers provide you with this insight upon every execution across futures, options, and cash treasuries.

Get 100% transparency on your trading performance with our TCA reports. Analyze every order, market activity, and performance metrics in real-time to optimize your trading strategies and improve your returns.
Simplify your calendar roll process with the Roll Tracker. This online tool offers a comprehensive view of current and historical futures roll activity across multiple asset classes and contracts to help you easily forecast, time, and execute.
Liquidity Tracker enables users to instantly visualize liquidity and quote size and compare it to historical data. The tool can be used to analyze book depth, and bid-ask spreads, visualize the current regime, perform market impact analysis, and act as a research and risk management tool.

The Microstructure Report displays a heatmap of the average changes in the microstructure of outright futures compared to historical averages across 1-month, 1-year, and 3-years for various markets, including Interest Rates, Equity, VIX, and Energy Futures.

Introducing the game-changing analytics tool that predicts performance for all futures contracts, regardless of size. You can optimize your investments by predicting the realized costs of buying and selling futures.

QB's sophisticated algorithms consider the uniqueness of each contract and market by calculating the significance weighting per scheduled economic event. Access calendars to understand the behavior based on historical data, variance curves, and impact analysis.

This forecasting tool uses 10+ years of market data to visualize and forecast the market’s movement in 10-minute increments, providing microstructure insights at the instrument level for futures instruments (outrights and spreads).

QB has a team of quants that continually analyze and publish research on market changes, trends, and ideologies. QB also has the potential for custom reporting and analysis based on clients’ needs.
Analytics so powerful, they will change everything
Quantitative Brokers is broker and front-end neutral. We integrate with our clients' preferred workflow so there is no need to change. By embracing intelligent execution algorithms you can achieve better execution and improved productivity.